Is Demand Shifting Across Your Portfolio?

A drop in rentals at one facility can look like weak demand. It can also be a transfer.
Customers do not make storage decisions in a vacuum. They compare unit sizes, prices, drive times, climate control, promotions, and availability. When one choice becomes less attractive or less available, demand often moves to another choice inside the same portfolio.
That matters. A facility-level report may show a decline. A portfolio view may show the customer never left the market.

Demand does not always rise or fall in a straight line
Self-storage demand is often measured at the facility level. Move-ins, leads, occupancy, asking rates, web traffic, and rental velocity all help explain performance. But each metric becomes more useful when compared across nearby assets and substitute choices.
A customer who wants a 10x10 non-climate unit may rent a 10x15 instead if the price gap is small. Another may choose climate control if the discount makes it feel affordable. A third may drive three more miles to avoid a high street rate.
From the customer’s point of view, these are normal trade-offs.
From an operator’s point of view, they can look like demand loss if the analysis stops at one site.
Portfolio demand can migrate across:
Facilities in the same trade area
Unit sizes with similar use cases
Climate and non-climate options
Ground-floor and upper-floor options
Drive-up and interior units
Standard rates and promotional offers
Shorter and longer drive-time choices
That is why self storage demand should be read as a market behavior, not only as a facility count.
The core question is simple: Did demand disappear, or did it choose something else you sell?
Substitution is part of every rental decision
Self-storage customers are practical. Many do not arrive with a fixed product requirement. They arrive with a problem.
They need to store furniture during a move. They need space for business inventory. They need a place for seasonal items. They need a unit quickly, close enough, at a price that feels reasonable.
That creates substitution.
A 10x10 is not always competing only with other 10x10s. It may compete with a discounted 10x15, a climate-controlled 10x10, a 5x15, or a nearby facility with better availability.
The same logic applies to climate control. A customer may prefer non-climate because it is cheaper. But if non-climate is tight and climate has a strong promotion, the customer may upgrade. That does not always mean climate demand increased independently. It may mean the pricing relationship changed.
Substitution is strongest when options feel close enough. A customer will compare:
Total monthly cost after the promotion ends
Unit size versus actual storage need
Drive time from home or work
Ease of access
Floor level
Perceived quality and security
Confidence that the unit will be available now
This is where portfolio analytics, unit mix, rental velocity, market intelligence, and self storage revenue management connect. Each discipline helps answer the same question from a different angle: where did the customer go?
A 10x10 decline may not be a demand collapse
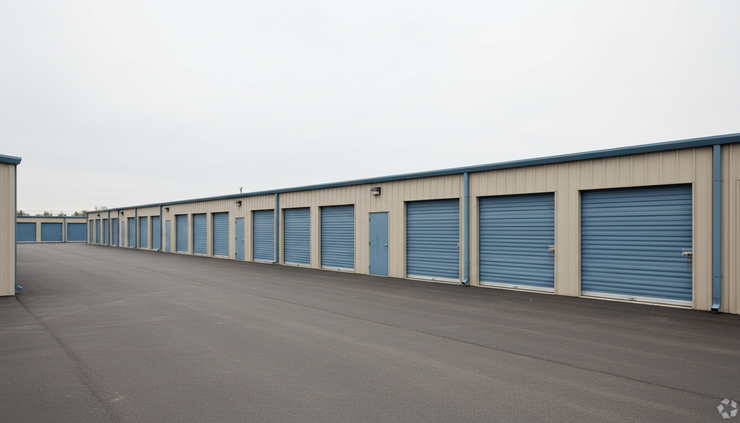
Consider a hypothetical market with three facilities in the same metro submarket.
Facility A has historically strong 10x10 rentals. Facility B sits two miles away. Facility C is four miles away near a growing residential area.
In April, Facility A sees 10x10 rentals decline. Leads are down. Move-ins are slower. The first reaction may be to lower 10x10 rates or add a broader promotion.
But the portfolio view shows a different pattern.
Facility | 10x10 trend | 10x15 trend | Possible reading |
Facility A | Down | Flat | 10x10 availability is limited, and rates are high relative to nearby options |
Facility B | Flat | Up | Customers are accepting larger units because the price gap is small |
Facility C | Down slightly | Up | Residential growth supports demand, but customers are trading up when units are available |
In this example, 10x10 rentals declined, but 10x15 rentals rose at nearby facilities. The operator did not necessarily lose the customer. The customer may have moved to a larger unit because the monthly rate difference was small, the promotion was better, or the 10x10 supply was constrained.
The wrong response would be a broad discount across the market.
That action could create three problems:
It may discount units that are already capturing demand.
It may train customers to wait for lower prices.
It may reduce revenue without fixing the real constraint.
A better response starts with diagnosis.
Look at price adjacency. If a 10x10 rents for $129 and a 10x15 rents for $139 after promotion, the larger unit becomes a simple upgrade. If the 10x10 has low availability, the decision becomes even easier.
Now add geography. If Facility B is closer to a highway entrance or a large apartment cluster, it may attract customers who would have selected Facility A in a looser market.
Now add timing. If Facility B ran a first-month promotion while Facility A did not, the apparent decline at Facility A may reflect a promotion-driven choice, not a demand failure.
The larger point is clear. Portfolio signals can explain facility-level weakness before pricing teams cut rates.
Price relationships can create hidden cannibalization
Cannibalization is not always bad. Sometimes it is the best available outcome. If a customer rents at one owned facility instead of a competitor, that is a win.
But unmanaged cannibalization can hurt revenue.
A portfolio can pull demand away from itself when:
One facility carries aggressive discounts while a nearby facility protects rate
Larger units become too cheap relative to smaller units
Climate units are promoted heavily enough to steal non-climate renters
New lease-up assets draw customers from stabilized assets without a clear plan
Online merchandising favors one location even when another has tighter revenue goals
This is not only a pricing issue. It is a market design issue.
The key is to separate productive capture from unproductive transfer. Productive capture brings in customers who might have rented from a competitor or not rented at all. Unproductive transfer moves the same customer to a lower-value option inside the portfolio.
A facility manager may not see that distinction. A revenue team can, if it reads demand across the trade area.
For example, a lease-up property may need aggressive promotions. That does not mean every nearby stabilized property should match. The right answer may be segmentation. Let the lease-up chase price-sensitive customers. Let the stabilized asset protect rate for customers who value location, access, or a specific unit type.
That approach requires confidence in the data. It also requires restraint.
Broad rate reductions feel decisive. They are also blunt. Once applied, they can reset customer expectations and pressure existing customer rate strategy.

Availability changes the meaning of demand
Availability can distort demand signals.
A unit type with low availability may show fewer rentals simply because there are fewer rentable units. The report may say demand is down. The real issue may be supply.
A unit type with high availability may show rising rentals because the portfolio is steering demand there through pricing, promotions, or search visibility.
This is why rental velocity should be read with inventory context.
A 10x10 unit type that is 96% occupied cannot produce the same move-in volume as a 10x10 unit type that is 82% occupied. If the high-occupancy asset shows slower rentals, it may still have strong demand. It just has little product to sell.
The same applies to climate control. If climate units are open and non-climate units are scarce, a promotion may shift renters into climate. Later, the data may show stronger climate move-ins. That does not prove the market suddenly changed its long-term preference. It may show that the operator changed the choice architecture.
Strong analysis compares:
Move-ins by unit type
Lead volume by unit type
Available units by unit type
Street rate and promotion by unit type
Conversion rate by channel
Distance between facilities
Competitor pricing and availability where known
No single metric is enough. Occupancy without rate misses revenue quality. Rate without velocity misses customer behavior. Velocity without availability can misread constrained supply.
One facility is not a market
A single facility view is useful for operations. It is limited for revenue decisions.
Facilities sit inside trade areas. Trade areas overlap. Customers cross boundaries when the value is clear. That means the portfolio creates its own internal market, especially in dense metros.
A site can underperform for reasons that have little to do with total market demand:
A nearby sister facility has a better promotion.
A competing facility has opened with new supply.
The local customer base has shifted toward smaller households.
A residential project has added demand closer to another asset.
A road closure or traffic pattern changed convenience.
The unit mix no longer matches the highest-velocity use cases.
Reading one location in isolation encourages simple answers. Cut the rate. Add a special. Increase ad spend. Push calls harder.
Some of those actions may work. Some may only move demand from one pocket to another.
Market segmentation makes the decision cleaner. Instead of treating all renters as one group, segment by behavior and need.
Examples include:
Segment | Likely priority | Revenue implication |
Moving customer | Availability and speed | May accept a higher rate if the unit is ready now |
Apartment renter | Size fit and monthly cost | Sensitive to small price differences |
Homeowner | Location and access | May value convenience over discount |
Small business | Access hours and reliability | May choose larger units or drive-up access |
Climate-sensitive renter | Condition of stored goods | May pay more when the value is clear |
Segmentation prevents overreaction. If only price-sensitive renters are shifting, a targeted promotion may work. If convenience-focused renters are shifting, the issue may be location visibility or product availability. If business renters are shifting, access or unit sizes may matter more than rate.
Better questions lead to better pricing decisions
When rentals slow, the first question should not be, “How much should we discount?”
Start with better questions.
Which unit types slowed?
Which unit types gained volume nearby?
Did average rented size change?
Did customers shift from non-climate to climate?
Did a promotion change the comparison set?
Did a nearby facility gain while another declined?
Did availability limit the unit type that appears weak?
Did competitor pricing create a new reference point?
Did the same lead sources send customers to different assets?
These questions protect margin.
They also protect the brand’s rate structure. A rate cut is easy to apply and hard to unwind. If the issue is substitution, not demand loss, a broad cut may reduce revenue while leaving the underlying shift unchanged.
The better move may be more specific:
Reprice only the unit sizes where velocity is truly weak.
Widen or narrow the price gap between substitute sizes.
Adjust promotions by facility instead of across the market.
Hold rate where availability is tight.
Redirect demand to the best-fit asset based on inventory.
Reassess unit mix over time if customer choice has changed.
This is where revenue management becomes less about reacting and more about reading customer movement.

FAQ
How can an operator tell if demand moved instead of disappeared?
Compare facility-level declines with nearby gains by unit type, climate type, promotion, and availability. If one product slows while a substitute rises nearby, demand may have shifted inside the portfolio.
Why are 10x10 and 10x15 units common substitutes?
Both can serve household moving and overflow needs. If the price gap is narrow, many customers will choose the larger unit because it feels like a better value.
When is cannibalization acceptable?
Cannibalization can be acceptable when it keeps the customer inside the portfolio and supports a clear strategy, such as filling a lease-up. It becomes a problem when it lowers revenue without adding true incremental demand.
Should operators avoid broad discounts?
Not always. Broad discounts can help when a market-wide demand issue is real. But operators should first check whether demand moved to another facility, unit size, or product type. Targeted actions often protect revenue better.
What data matters most for portfolio-level demand analysis?
Move-ins, availability, rates, promotions, lead source, conversion, unit type, facility distance, and competitor context all matter. The value comes from reading them together.
The takeaway is to find the movement before changing the price
Demand rarely sends a clean signal. Customers compare options. They trade size for price. They drive farther for availability. They accept climate control when the offer makes sense. They shift from one facility to another when the portfolio gives them a better choice.
A facility-level decline may be real. It may also be incomplete.
Before cutting rates across a market, trace the customer path. Look at the nearby gains. Study substitute sizes. Check availability. Compare promotions. Segment the renters. Then decide whether to defend rate, redirect demand, adjust price relationships, or make a targeted offer.
A.R.M.S. Revenue Intelligence is built around that portfolio and market view. It helps operators see where demand is moving, not just where it has slowed. To see how that approach supports better pricing and revenue decisions, visit A.R.M.S. Revenue Intelligence.
The strongest revenue decisions start with a broader question: not just what changed, but where the customer went.


Comments